
Most Splendid Housing Bubbles in Canada, November Update, after Bank of Canada
Home prices spike in a few cities, “pause” in some, drop in others. Vancouver prices are below August levels.
By Wolf Richter for WOLF STREET.
In an amazing development for the Canadian housing market where prices have relentlessly exploded higher – fueled by money printing and interest rate repression that started in March 2020 – prices in November didn’t explode higher in all cities, but only in a few, and “paused” in some, and declined in others. In the most hyped red-hottest housing market of them all, in Vancouver, prices were below the peak in August.
So maybe this is just a seasonal breather in those markets. But last year and for most of this year, there were no seasonal breathers in Vancouver or any of the other major markets, the whole thing just went exponential, fueled by the Bank of Canada that was printing money and repressing interest rates like there’s no tomorrow.
But this is tomorrow.
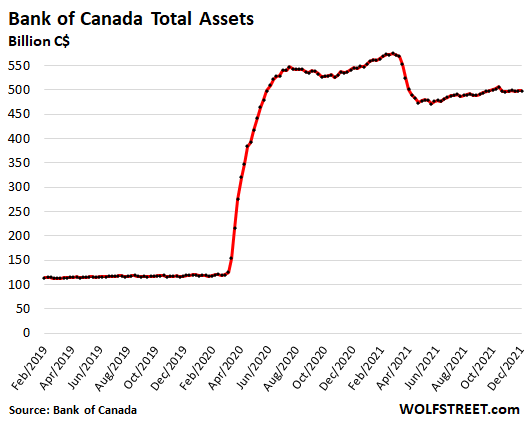
The Bank of Canada announced its first taper decision in October 2020, over a year ahead of the Fed. It let repos and short-term Canadian Treasury bills mature and run off the balance sheet without replacement. It ended other smaller purchase programs. In October 2021, it ended QE altogether, and is no longer adding to its holdings of Government of Canada bonds. And it has put rate hikes on the table.
Throughout this 14-month period since the taper announcement, the BoC has pointed at the excesses in the Canadian housing market that resulted from the BoC’s reckless asset purchases and interest rate repression.

And inflation in Canada has reached the worst levels since 1992, as measured by CPI in November (+4.7% year-over-year).
Total assets on the BoC’s balance sheet, as of Friday at C$498 billion, have been roughly flat since the end of October and are down 13% from the peak in March.
And here is how the housing market in Canada responded.
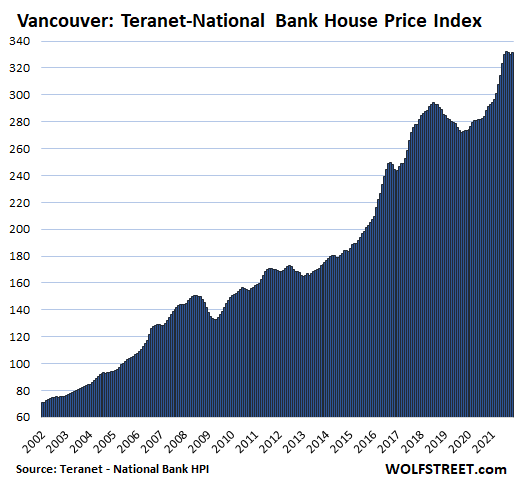
Greater Vancouver, one of the world’s biggest housing bubbles, “pauses.” House prices, after falling 0.4% in October from September, ticked up 0.4% in November and are down by 0.3% from August, according to the Teranet-National Bank House Price Index, released on Friday. This whittled down the year-over-year gain to 13.9%, the slowest such gain since March.
The BoC’s reckless monetary policies, starting in March 2020, performed a miracle on Vancouver’s housing downturn that had started in August 2018 and converted it into another exponential spike that is now broken:
The Teranet-National Bank House Price Index uses the “sales pairs” method, similar to the Case-Shiller Home Price Index in the US, by comparing the price of a house that sold in the current month to the price of the same house when it sold previously. It thereby tracks the change in how many Canadian dollars it takes to buy the same house over time, and is thereby a measure of house price inflation.
The charts here are all on the same scale. As we go down the lineup, the markets with smaller two-decade house price increases have larger white spaces above the curve.
In the Greater Toronto Area, home prices rose 0.8% in November from October. The year-over-year increase remained at 16.3%, down…
Read More: Most Splendid Housing Bubbles in Canada, November Update, after Bank of Canada