
US Wholesale Price-Spike Worst in the Data, Even Services. But Further up the
Raging price pressures in the pipeline are heading for consumers.
By Wolf Richter for WOLF STREET.
Even as consumer price inflation has spiked at the worst rate in 40 years, far-worse inflation rages further up the price pipeline as it’s flowing toward consumer prices. Going up the inflation pipeline of goods and services from the Consumer Price Index (CPI), we first get to the producer Price Index (PPI) for Final Demand, and further up the price pipeline, we get to the four stages of the PPI for Intermediate Demand.
At Intermediate Demand Stage 1 industries, furthest up the pipeline, whose production creates the inputs for industries in Stage 2, prices exploded by 20.8% year-over-year (green line), according to the Bureau of Labor Statistics today. At Stage 2 industries, which create the inputs for industries in Stage 3, prices exploded by 28.1% year-over-year, the worst in the data going back to 2010 (red line). At Stage 3 industries, which create the inputs for Stage 4, prices exploded by 20.6% year-over-year (gray line). And at Stage 4 industries, which create inputs to Final Demand, prices shot up by 12.9% (black line):
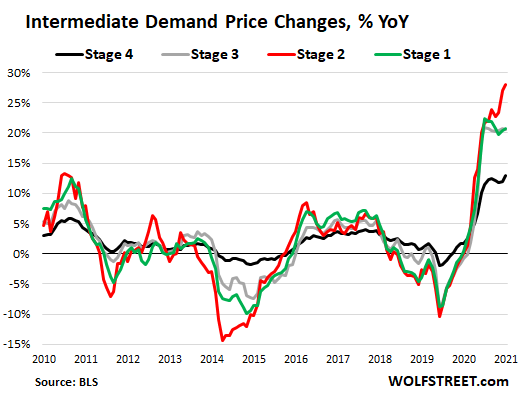
These red-hot price increases up the pipeline in the four stages of Intermediate Demand are increasingly getting passed on to the next industry in line, and the price increases from prior months are now arriving at the Final Demand industries.

Producer Price Index for Final Demand.
The PPI Final Demand tracks the input prices for consumer-facing industries whose prices then become part of the Consumer Price Index, which already jumped by 6.8% in November, the worst since 1982. But consumers still get to look forward to the impact of the producer prices in November that we’re looking at today.
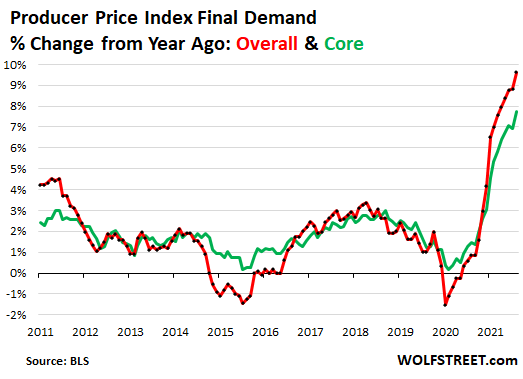
The PPI Final Demand jumped by 0.8% in November from October. Compared to November last year, the PPI spiked by 9.7%, by far the worst ever in the data going back to 2010 (red line).
Without the volatile food and energy prices, the “Core” PPI Final Demand, jumped by 0.7% for the month and by 7.8% from a year ago, also the worst reading in the data (green line).
Blame the “base effect?” Nope.
In October 2020, the PPI Final Demand rose to an index value that set new highs in the data series and hasn’t looked back since. The year-over-year spike in November 2021 is based off the already record high index levels last year.
But prices of services spiked.
Oh, I know, bottlenecks, supply chain chaos, semiconductor shortages, ocean shipping nightmares, container pile-ups, the whole litany – those are massive problems. But they’re no longer the only factor fueling this raging inflation. Services have caught the inflation bug, and services have nothing to do with semiconductor shortages and shipping containers. But services providers too are raising prices because they can.
The price index for Final Demand Services jumped by 0.7% in November from October, the 11th month in a row of month-to-month increases, and by 7.1% year-over-year, the highest in the data going back to 2010.
Some of the drivers in the price increases of Final Demand Services in November were portfolio management; guestroom rental services;…
Read More: US Wholesale Price-Spike Worst in the Data, Even Services. But Further up the